🔥What is tax equity and why should I care?

There is quite a bit of confusion regarding what tax equity is for renewable energy and how it can be taken advantage of. This is largely because tax equity structures are ubiquitously understood to be complicated, meaning many firms just don’t bother with them. That’s a mistake. Tax equity can be a powerful incentive for developing RE in the USA.

Companies that have managed navigate the system have been able to reap the benefits of tax equity structures, but new entrants can be deterred, therefore bypassing potential benefits.

What is Tax Equity?

Tax equity is where renewable energy and tax policy intersect.  Basically, tax equity is a creative and complex way to split the benefits of installing and producing RE electricity from their corresponding tax benefits.

Tax credits, however, can only be used by clean energy developers who are profitable enough to pay larger amounts of taxes. Because of this, many smaller players, who are not very profitable cannot reap the benefits of tax credits. Hence, they must find an investment partner with enough income to be able to reap credible benefits from tax credits.

Installing renewable energy is subsidized by a tax credit. This means that a solar project developer/company/host wants to have the benefits of solar electricity production (via decreased utility bills)  but does not the tax liability to use the tax credits, so it passes those credits to an investor who in return puts up capital to pay for the solar project. The objective is to reduce its own tax bill by receiving the tax deduction.  Tax equity financing is primarily provided by large banks, insurers or big corporations which provide upfront investment in exchange for tax credits associated with the development of (usually) solar energy projects.

Example:

Take solar developer start-up, Sunny Ltd., who wants to develop a large solar PV project. The cost of the project would be $1m. Although such an investment in RE carries corresponding tax credits, Sunny Ltd. is currently not profitable enough to take advantage of them, so they decide to rope in a Tax Equity Investor. The Tax Equity Investor, represented by Capital One Bank, wants to apply the tax credits to their own corporate tax bill.

So Capital One Bank can put up, say 40% of the solar project financing, used as equity (the remaining 60% hypothetically will come from debt).

So if the bank puts up $400K in equity, they could hypothetically reduce their tax bill by a certain amount over the course of a contract.

State of the Market

According to specialized law firm Chadbourne & Park, the market is steadily increasing. The U.S wind and solar markets in 2015 saw $11.5 billion in new tax equity deals, up from $10.1b from the year before. According to John Eber, head of energy investments at J.P Morgan, of that 11.5b, $6.4b was secured in the wind marketplace for projects totaling 5,700 megawatts capacity. There was three main sponsors int he winds tax equity investors that completed deals totaling $1b each (47% of tax equity raised in 2015). 

In the solar residential tax equity market, about $2.6b was raised by three leading residential solar companies, accounting for 90% of the residential market, (up from $1.9b in 2014). Eber went on to say that distributed generation and utility-scale solar marketplace accounted for an additional $2.5b in tax equity deals. Eber says there are about 20 active tax equity investors in the wind marketplace and 27 in solar, with some crossover, and of the 20 active investors in wind, 17 entered into deals in 2015.

The small number of players is attributed, in part to the complex nature of tax equity and the associated costs and in part due to the fact that tax equity investors must have very large tax liabilities, to justify such operations.

But be that as it may, it is still a huge increase if you consider that after the financial crisis, the number of Tax Equity Investors collapsed from 14 providers to just 5 (Jacoby, University of Pennsylvania Law Review), since in order to take advantage of tax equity, you need to have huge tax liabilities and the after 2008 fewer companies had the necessary tax liabilities to make tax credits attractive.

Before we have a look at a few tax equity structures used, bear in mind who the stakeholders are:

Tax Equity Agreements usually have three stakeholders, although sometimes the developer and host are the same:

  1. A Developer (ex. a solar PV installer like SolarCity or FirstSolar ) who identifies a potential solar project and decides to undertake the costs and risks of engineering, procurement, installation, and commissioning;
  2. The Solar Host who is usually either a residential or commercial building owner, and is interested in the benefits of solar power;
  3. A Tax Equity Investor who usually is an institution like a bank or a corporation like Google, that has to have two things:
    1. high tax liabilities, or at least high enough to make a tax credit attractive
    2. the liquidity necessary to undertake the development of a solar project.

The Tax Equity Investor has to agree to finance and own the project for a number of years and in return for undertaking the construction and ownership costs of the solar project the company will receive the corresponding tax deductions.

The Tax Equity Investor is the defacto owner of the physical solar panels, while the benefits go to the host, and once the Tax Equity Investor reaps in the desired returns brought by the tax credits associated with the solar projects they return ownership to the developer.

Tax credit structures can vary quite a bit, but here are the two most common types:

The Partnership Flip

As you can probably imagine, a Tax Equity Investor does not necessarily want to hang on to the solar panels for the entire life of the project- why would they? Enter The Partnership Flip. This is where the ownership of a project is owned by both developer and tax equity investor but in varying degrees. 

partnershipflip

capture22
Source: Woodlawn Associates


The Tax Equity Investor and the developed enter into a partnership in which the have joint ownership of the solar project. Say, at the beginning of the project the ownership the Tax Equity Investor will hold 90% while and the developer will own 10%. Progressively, as the Tax Equity Investor begins to reap the rewards of the tax credits, the ownership of the project will begin to “flip”, whereby the Tax Equity Investor will own 60% and the Developer 40%…then 50%-50% until it is 10%-90% for the Developer.

Sale – Leaseback Agreement

screen-shot-2017-02-05-at-22-19-16
Source: Woodlawn Associates

This agreement sees the solar developer selling the project to the tax equity investor and then the tax equity investor leases it back to the solar developer. It’s actually simpler than a partnership, because all the tax benefits pass directly to the tax equity invest right away, whereas with a partnership, years pass before the Tax Equity Investor reaps all the benefits.

The Developer will install, operate and maintain the project and a Host will agree to purchase the power generated from the project, via a PPA.

The Investor keeps all the tax benefits and receives payment (cash) in the form of rent from the solar developer. The developer’s revenue from the PPA is used to make rental payments under the lease. The developer has a taxable gain on the sale of the project to the extent that the value of the project exceed the cost to build it. Indeed, the developer will usually have the option, exercisable at the end of the lease period, to buy the project from the investor at its fair market value.

The developer and the tax equity investor are like to two passengers in a car, when the car hits a bump, they are both impacted.

With solar and wind installations predicted to increase, 2017 will definitely see more tax equity deals for renewable energy, but what remains to be seen is if investors will be able to keep and meet the capital requirements of the industry.


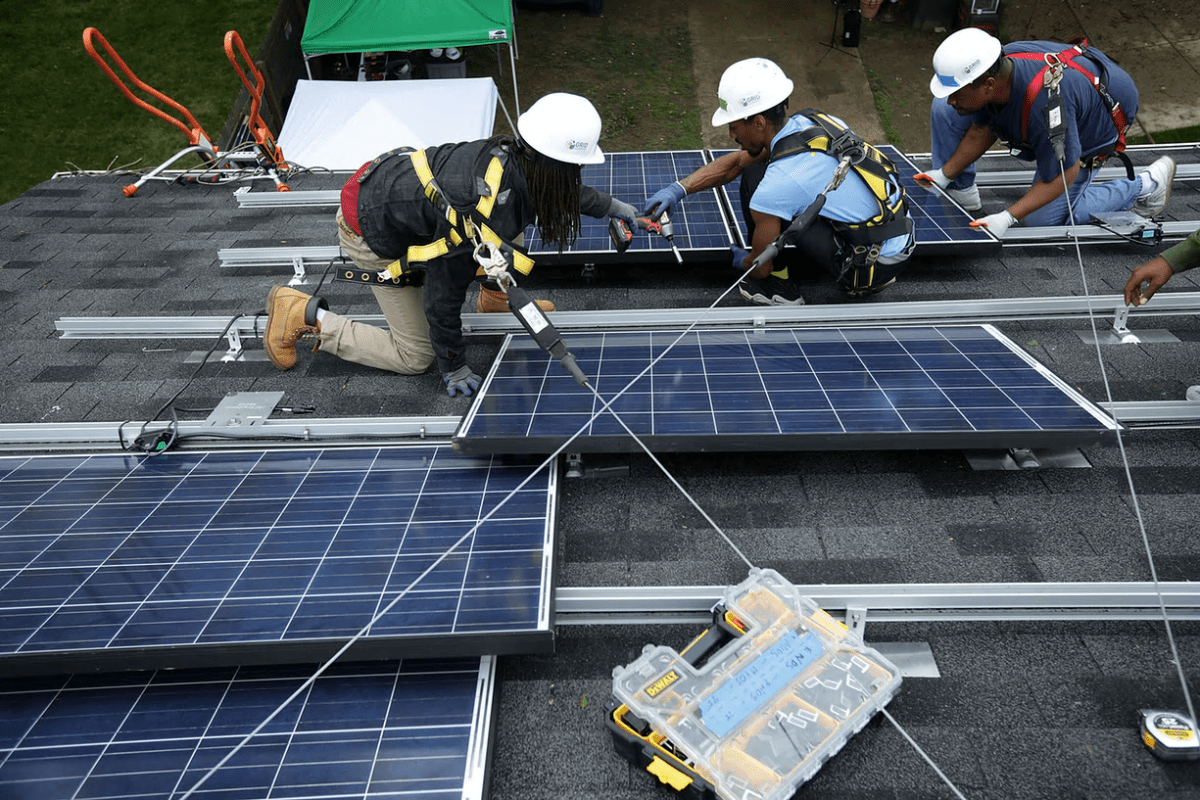
Cover Photo: Ian Waldie/ Getty Images

☀️Sunny Saudi is Going Solar

There is a famous quote by Former Saudi Oil Minister from 1962-86 Sheik Zaik Yamani that people in (renewable) energy never tire of throwing out there,

“The Stone Age did not end for lack of stone, and the Oil Age will end long before the world runs out of oil” – Sheik Zaik Yamani

Sheik Yamani was no wishful thinker.

Energy shifts happen, in part because of poles pulling in different directions, not necessarily because of a lack of supply. There is plenty of oil in the ground and it is being extracted more cheaply and efficiently than ever before, yet the current environment is propelling Saudi Arabia (&Co)  into the opposite direction. 

Today, when someone mentions Saudi Arabia’s energy mix, what usually comes to mind is crude, crude and more crude, but come a few years this will change radically. With the nosedive that the oil price took in the last few years, Saudi Arabia is launching a massive renewable energy plan to try to replace some, if not all, of their energy needs.

The Plan

Newly appointed energy Minister Khalid al-Falih, a graduate of Texas A&M University and Chairman of Aramco, intends to launch an ambitious renewable energy program and is currently soliciting tendering bids. The program, which is to be officially launched “very soon” is expected to involve an investment of between $30 billion and $50 billion by 2023, he said at a press conference in Dubai.

solar-panel-tv
Minister al-Falih interviewed by CNN’s Becky Anderson @ ADSW 2017, Solarpv.tv

The plan involves the development of almost 10 gigawatts of renewable energy by 2023, starting with wind and solar plants across the sun-soaked northwestern desert. The effort has the potential to replace the equivalent of 80k barrels of oil a day now burned for electricity generation.

According to Bloomberg, bidders seeking to qualify to build 700 megawatts of wind and solar power plants should submit documents by March 20, and those selected will be announced by April 10, Saudi Arabia’s energy ministry said Monday in an e-mailed statement. Qualified bidders will be able to present their offers for the projects starting on April 17 through July.

The Kingdom intends to require all investors to invest in the local supply chain of goods and services, so as to render themselves more competitive.

🇸🇦The Kingdom’s Electricity Needs

Relying heavily on hydrocarbons as feedstock for the electricity sector, Saudi Arabia is by far the largest user of crude oil for power generation in the world. Oil accounts for two-thirds of the input into electricity generation, with natural gas providing most of the remaining portion, according to the Joint Organizations Data Initiative (JODI). During the prohibitively hot summer months, consumption of electricity increases as domestic demand for air conditioning rises. The Kingdom has recognized that this is both highly inefficient, expensive and unsustainable.

main
EIA, JODI

Saudi Arabia used an average of 0.7 million bbl/d of crude oil for power generation during the summers from 2009 to 2013, which is massive. To put this into perspective, that same period, Iraq and Kuwait, the next two largest users of crude oil for power generation in the Middle East, each averaged roughly 0.08 million bbl/d of crude burn. At the same time, net electricity consumption in Saudi Arabia has more than doubled since 2000.

Shifting the energy mix towards renewable energy would bring about several key advantages:

  1. Local Emissions Reductions: more on that later;
  2. Economics: The Kingdom has seen two years of budget deficit, and is looking at a $53b deficit moving into 2017. Stubbornly low oil prices have forced austerity measures on a country that is not associated with belt- tightening measures. In the context of the 2018 Aramco IPO prospected to raise $100b, it is clear that the economic tide is shifting. With the Kingdom’s main sources of income: oil exports, decreasing due to a number of economic factors, this leaves less for exporting and therefore less revenue. By shifting to renewables, they aim to free the crude currently being consumed domestically so they can export it, thus generating more revenue;
  3. Diversification: diversifying their investment portfolio away from oil is recognition that an economy based on the export of crude is, as demonstrated, highly vulnerable to prices drops and other external shocks.
brent
Price Oil Drop from 2014- Feb 2017

Saudi Arabia has boosted output for years to sustain export income while also satisfying domestic demand. Demand for refined fuels such as gasoline has doubled since 2003, according to JODI. Moreover, Saudi Arabia, the UAE, Qatar, Oman, and Bahrain have significantly reduced or eliminated fuel subsidies over the past year to limit government spending because of low oil prices. Brent crude is trading at $55 a barrel today compared to $112 per barrel between 2011 and 2014.

Domestic demand for oil increased by about 24,000 barrels a day in the first five months of 2016, the slowest growth rate for that period since at least 2010, the first year according to JODI.

1x-1
Bloomberg, 2016

Mario Maratheftis, chief economist at Standard Chartered Plc. said, according to Bloomberg, “Renewable energy is not a luxury anymore – If domestic use continues like this, eventually the Saudis won’t have spare oil to export.’’

Without alternative power sources, including gas and renewables, the kingdom would be forced to increase the amount of crude it burns, diverting it from exports. That can reach as high as 900,000 barrels a day during the kingdom’s summer months, according to data from the JODI.

Saudi Arabia has already taken steps to substitute natural gas for oil in power plants, a change that’s had “immense” impact on the crude burn, OPEC said in its Monthly Oil Market Report released in January. The use of crude for domestic power has fallen by nearly 1/3rd since the Wasit gas plant began operations in March 2016, according to the OPEC report.

300,000 Barrels

Saudi Aramco will bring online the similar-sized Fadhili gas project in the country’s east by the end of the decade. That gas project along with the renewable projects, planned for completion by 2023 could save about 300k barrels of oil from being burnt for power, according to estimates based on IEA and OPEC data.

According to Fabio Scacciavillani, chief economist at the Oman Investment Fund, “Alternative energies are a key factor in the economic transformation, this region has a great competitive advantage in low-cost energy production and that will continue with renewables. That will create a big advantage particularly in energy-intensive industries.’’

On top of that, the Saudis want to build nuclear reactors, a less ambitious program that would see 2.8 GW of new electric capacity.

The end goal is to generate 30% of the Kingdom’s electricity from renewable sources by 2030, with the remainder to come from natural gas and a small portion from nuclear.

Deputy Crown Prince Mohammed, at the forefront of promoting reforms and development in his country, said, “I think by 2020, if oil stops, we can survive…We need it, we need it, but I think in 2020 we can live without oil.”

The Tide is Turning to an Energy  Transition

It goes without saying that the primary reason the Saudis are shifting to renewables is economics rather than emissions, yet we can still predict some emission reductions.

It is clear that the Kingdom does not expect oil prices to increase above $100 like it was a few years ago. They know that the days when they would squeeze massive economic rent out of oil have passed. Their long-term objective is to ensure the future competitiveness of their oil in a global environment where paradoxically, fossil fuels are abundant and renewable energy has a higher penetration, while still decarbonizing their energy sector.

This takes me back to Sheik Yamani’s prediction. It is not so much that the Kingdom is physically running out of oil to sell as much as the energy environment is changing. The supply is outpacing demand and oil is just not as profitable as it was. The hammer blows of energy efficiency, renewable energy, and global economic trends are forcing a transition to better options.

Sheik Yamani’s prediction is coming to life.


The Employer of the Year is….(Renewable Energy)

I have heard it said:

“The [traditional] energy system employs millions of people!”

“Renewables will create massive job losses!”

“Fossil fuels may not be good for the planet, but at least they employ millions!”

and last but not least:

“Green jobs are the miracle that never happened”

Far be it for me to assess whether green jobs were ever meant to be “miraculous”, but I will say that “green jobs”, defined by the US Bureau of Labor Statistics (BLS) as either “jobs in business that produce goods and services that benefit the environment or conserve natural resources” or as “jobs in which workers’ duties involve making their company’s production process more environmentally friendly or use fewer natural resources”, are increasing at unprecedented levels.

capture
Number of Jobs in Renewably Energy, Irena, 2016

The International Renewable Energy Agency (IRENA) published their annual report detailing employment in the IRENA’s 2016 report, (link here – to learn more about their methodology, I suggest you check it out) estimated total employment in the RE sector to amount to 8.1m people. Adnan Amin, director-general or IRENA commented on the report stating, “The continued job growth in the renewable energy sector is significant because it is in contrast to trends across the energy sector. The increase is being driven by declining RE technology costs and enabling policy frameworks.”

Most of these jobs are in China, Brazil, USA, India, Japan, Germany, Indonesia, France, Bangladesh, and Colombia.

capture1
Renewable Energy Jobs by Country, Irena, 2016

Jobs in renewable energy increased by 18% from the estimates reported two years ago with a steady regional shift towards Asia.

In 2014, the Solar PV emerged as the largest employer in the energy sector accounting for 2.8 million jobs, an 11% increase from last year, and two-thirds of which were in China. Solar PV grew the most in USA and Japan while decreasing in Europe. Indeed, the global aggregate production of solar panels keeps increasing and pushing further into Asia, with lower costs of installations driving that accelerated growth. Global wind employment crossed the 1m job mark, fueled mainly by deployment in China, Germany, the USA, and Brazil.

Although, it’s good news (mostly) all around, the winner this year is:

🇨🇳Gold Medal: China

China has firmed up to be the leading renewable energy job market in the world, with 3.5m people employed. Domestic deployment and rising solar PV demand solidified that growth at 4% to 1.4m jobs. Chinese Solar PV jobs are focused on manufacturing (with 80%) following by installations and operations. The largest solar water heating technology industry and market are in China since they provide for both domestic and international demand. Half of the global wind jobs are in China, and more than 70% of those are in manufacturing.

Moreover, China is also is a leader in hydropower employment, as they add 75 GW of new projects between 2014-2017. Construction and installation account for 70% of the countries large hydropower employment.

Indeed, China has and installed 65 gigawatts more in renewable energy in 2015, shift the labor force from oil and gas, towards renewables. Now, China employs 3.5m people in renewable energy and only 2.6m in oil and gas, that 35% more people in RE than in oil and gas (coal excluded).

capture
Source: Irena, taken from Bloomberg

Although the lion’s share of the RE labor force is employed in manufacturing, this growth rate is likely to begin to contract, in spite of growth in technological deployment due to:

  1. market consolidation in favor of large suppliers/ manufacturers resulting in economies of scale;
  2. automation of process will make manufacturing more efficient, which will make it less labor intensive.

The runner up is:

🇺🇸Silver Medal: United States

Renewable energy jobs in the USA have increased at a historic pace, owing to large consumer demand and constantly declining prices of RE, especially solar. The Solar Foundation’s National Solar Jobs Census 2016 found that the solar industry accounts for 2% of all jobs created in the US over the past year, with the absolute number of solar jobs increasing in 44 of the 50 states. As of November 2016, there were 260k solar workers employed in America, “representing a growth rate of 24.5% relative to November 2015” according to the report.

This is great news all round since it signals that solar is receiving investments and creating thousands of high-skilled jobs, ultimately driving growth, strengthening businesses and reducing emissions (pollution) in cities. Moreover, wind recovered from a policy-induced slump in new installations and saw wind jobs rise by 43%.

Moreover, according to the annual U.S Energy Employment Report, published January 2017, more people are employed in solar power last year than in coal, gas, and oil combined. They report found that 43% of the total electric power generation workforce was employed in solar energy while fossil fuels accounted for a mere 22%. The report goes on to say that the US solar installation sector alone employs more than the domestic coal industry. Since 2014, solar installation has created more jobs than oil and gas pipeline construction and crude petroleum and natural gas extraction combined.

sourcesirenausbofstatisticsbloomberg
Source: Department of Energy, BLS, taken from Bloomberg

The electricity mix in the USA is shifting decisively in the direction of renewable energy, driven by the transition from coal-fired power plants, to gas and now, steadily in low-carbon energy sources.

🇧🇷Bronze Medal: Brazil

Employment in RE in Brazil is concentrated in the cultivation and production of biofuels. I am aware that there is a huge debate regarding whether of not biofuels production (especially from sugarcane..etc) is considered a real “green job” but that is an argument for another day, but today, I will be counting them as green jobs.

With 821,000 jobs, Brazil continues to have the largest liquid biofuel workforce by far. Reductions of about 45,000 jobs in the country’s ethanol industry (due to the ongoing mechanization of sugarcane harvesting, even as production rose) were only partially offset by job growth in biodiesel. Biofuel production, especially in a developing country tends to be labor intensive, on account of inefficiency and poor access to technology, which have explained why those working in biofuels in Brazil are just under 1m people.

However, Brazils wind energy sector is growing rapidly, which power capacity expanding from 1 GW in 2010 to 6 GW in 2014. Moreover, while there was one mere wind power equipment manufacturer, there were ten in 2007, indicating the sector is maturing. Most of these jobs are in construction and manufacturing.

Brazil’s solar heating market is expanding strongly in the past decade. In 2013, there were an estimated 41k people employed, between manufacturing and installation.

🇪🇺Consolation prize: European Union

Owing to a mélange of adverse policy conditions, regulatory uncertainty and a sharp decrease in investment, the number of RE jobs in the EU declined from 1.25m to 1.2m. Germany, however, is the euro leader in terms of job, with 271k jobs in RE. This is more than double the runner-up, France, which is ahead of UK, Italy, and Spain. RE employment in France fell by 4%- primarily because solar PV installations dwindled by 45%). We are likely to see a shift, due to Denmark and the UK’s ambitious off-shore wind plans which will (if they go through with them) likely create expansion in the near future. The EU has been suffering consistent defeats against China in terms of lower manufacturing competitiveness and a weaker installations market, leading to a net decrease in solar jobs… for now.

“But Jobs!”

Growing awareness of the harmful effects of GHGs on the environment and on our health, coupled with consumer preferences are pushing investment into renewable energy, leading to logical increases in employment in RE.  Conversely, the tumbling price of oil has led to a slowdown of industry expansion (too expensive deep off-shore, arctic projects, and unconventional drilling) and the corresponding reduction in capital expenditure and operational expenditure has had significant effects on the oil and gas labor force.

I do not think that the “But what about the jobs!” argument to be complete without merit. But a growing trend and body of evidence point to the fact that potential job losses in the traditional energy sector can be compensated by green jobs, however, an argument runs in parallel with this reasoning. And that is the fact that energy jobs are geographically and personally specific, meaning you can’t plug a worker out of an oil field in Texas and jettison them into a solar PV role easily. Re-skilling, training, and compensation for job losses are some of the conversations we will have to have in the next few years.

Nevertheless, the writing is on the wall.


Cover picture: Alex Wong, Getty Images

Clean tech companies! Venture Capital is not for you

Innovation and tech breakthroughs are key drivers of the renewable energy (RE) and clean tech sectors, and in this regard, venture capital (VC) has a powerful grip on the imagination. Indeed, some of the biggest names in tech, like Amazon, Google and Uber are around today thanks to VCs. This has led many to wonder, where are the big, ubiquitous clean tech start-ups that made it big?

Except it’s not as simple as that, collective imagination romanticizes VC, but it is important to separate the myth from the reality and understand that the RE sector is categorically different from IT and tech, and that VC does not lend itself well to the clean tech.

A bit of backstory first: Boom and Bust cycles

In 2005, VC investment in clean tech was in the hundreds of millions. The following year, it increased to $1.75b, according to the National Venture Capital Association. By 2008, investment had skyrocketed to $4.1b (see figure 1). And the US government followed the trend, eager to continue to develop the meteoric rise of promising innovative technologies through a mix of loans, subsidies, and tax breaks. They directed $44.5b into the sector between 2009 and 2011. In other words, the clean tech sector was in full throttle and VCs thought it was ripe for disruption.

venture-capital-boom-and-bust
Gaddy, Sivaran & O’Sullivan, MIT Working Paper, 2016

But then, due to a confluence of unfavourable events, including:

  1. Fluctuating silicon prices: According to a GTM Research report, high purity silicon (polysilicon), the principal material for solar panels played only a minor role in this price collapse, as over 80% of polysilicon is sold via long-term contracts, and the pricing on these contracts moved little for most of 2011. However, the oversupply in the polysilicon market shifted the spot price of silicon down from $80 per kilogram in late March 2011 to under $30 per kilogram in December, which resulted in a 60% price drop. This lower spot price gave silicon customers the leverage to renegotiate contract pricing downward, and this resulted in much lower realized silicon average selling prices (ASPs) moving forward;
  2. Newly cheapened natural gas (shale boom): Since gas has got so cheap, there was no longer a financial incentive to go with renewables. Technical breakthroughs in natural gas extraction from shale, namely fracking—have opened up reserves so massive that the US has surpassed Russia as the world’s largest natural gas supplier. Because 24% of electricity comes from power plants that run on natural gas, that has kept downward pressure on cost to just 10 cents per kilowatt-hour, and producing significantly less than half the CO2 pollution of coal at that. This new environment made investors divert capital from RE into natural gas;
  3. The 2008 financial crisis: A large proportion of the gains VC firms had made between 2003 and 2007 disappeared, and the sudden and unexpected lack of capital, coupled with the difficulty of taking smaller companies public, hit renewable startups particularly badly. Venture investments in clean tech fell from $4.1 billion in 2008 to $2.5 billion in 2009, which made it difficult to raise money to achieve manufacturing scale;
  4. China’s high paced production of solar infrastructure: Globally increasing demand for solar infrastructure combined with a domestic push on solar manufacturing had propelled China to the top position in terms of PV manufacturing countries. Indeed, since 2004, China’s meteoric production on all fronts of the solar manufacturing value chain, beginning with polysilicon feedstock, to wafers, to cells and modules. By 2008, the ascent of solar industry became so formidable that Chinese firms started reaping economies of scale in the production of purified silicon. By then, China had become the largest PV manufacturer in the world, with 98% of its product shipped overseas.

The clean-tech bubble had burst and the euphoric VC investments came to a swift close. Moreover, shares of public clean tech firms traded at steep discounts to the market peak in 2008, and almost all of the 150 renewable energy start-ups founded in Silicon Valley over the past decade had shut down or were on their last legs. The fallout sent ripples through to every niche in the clean-tech sector: wind, biofuels, electric vehicles, fuel cells and especially solar.

The most prominent casualty of this financial carnage was Solyndra, a start-up designing and manufacturing cylindrical solar tubes, which had received $500 million in federal loan guarantees but after the price of polysilicon crashed they were forced to file for bankruptcy. 

The Venture Capital Model: How it works

In a nutshell, VC funds are usually structured as 10-year “partnerships”, where external investors (the limited partners, or LPs) provide capital to the VC fund (run by the experienced general partners, or GPs) to make investments on their behalf.  The Model is summed up nicely below.

how-vc-works
Zider, Harvard Business Review, 1998

VC investment usually goes like this:

  1. Part 1: A fund will tend to invest in a portfolio of 10-20 start-ups over the first 5 years and harvest the returns in the remaining 5 years.
  1. Part 2: Ideally, sizable returns begin to materialize when a portfolio company is acquired by another firm or when it issues shares on a public market through an initial public offering (IPO)—these events are known as “exits.”

VC funds also tend to invest at several stages of a company’s development, starting with early “seed” rounds, typically $1 million or less, continuing through the next rounds (known as “A”, “B”, “C” rounds). The objective of the VC is to exit and get your returns, but if a company cannot exit within three to five years of raising a major funding round, the VC is likely to write off the investment.

Bear in mind that VCs have contractual investment structures that limit their scope. Take a company that doubles its revenues every year for 20 years, and expands from thousands in revenue to billions, a VC would most likely not touch it, because a VC could not wait 20 years because their funds are could be structured with a requirement to earn returns every 10 years. VC are extremely impatient.

The point of VC is, in theory, to invest in the balance sheet and infrastructure of a company until it reaches sufficient size and credibility so that it can be acquired by a competitor or so that the institutional public-equity markets can step in and provide liquidity. The venture capitalist is, essentially, buying a cut of someone’s idea, nurturing it for a short period of time so that it becomes profitable, the with the help of an investment bank, exiting.  As long as venture capitalists can exit the company, before the company’s’ value ceases rising, they can reap huge returns at a relatively low risk. Indeed, really good VCs operate in “secure” niche environments, where they know the industry inside out, and where traditional low-cost financing is unavailable.

What is a VC’s target investment?

Now, I know, you can point to Tesla, or Boston-Power Inc, a lithium ion battery provider or Sunnova Energy Corp, a provider of residential solar systems, that both raised $250m from VCs, and I agree, there are also many success stories.

In 2014, according to the National Venture Capital Association, the sector as a whole raked in $2b, which is a 41% increase relative to 2013, but it is a 30% decrease compare to 2012. The absolute number of clean tech deals is also up, suggesting that VC are being much more judicious with their investments.

Classically, sectors such as IT and software are ideal recipients of VC. According to Ghosh and Nanda from Harvard, (for more info, check out Ghosh & Nanda,  Venture Capital Investment in the Clean Energy Sector. Harvard Business School Working Paper. doi:10.2139/ssrn.1669445), this is mainly due to:

1. Lower levels of capital intensity are highly desirable for VC investors. As you can see in the figure below, the “sweet spot” for VC is typified by high technology risk, but low capital intensity, where a syndicate (a group) of two or three banks can completely fund a start-up through to its IPO.  The ability to reduce risk capital and quickly access infrastructure capital is a key differentiator between the IT sector and  RE start-up. RE technologies are usually large-scale systems with sizeable physical footprints. They are costly to not only to build but also to operate and maintain. Making a company on the supply side of the energy business requires a serious investment on the industrial side that the VC firms didn’t fully reckon with.

imgonline-com-ua-twotoone-jgzdzwenzhgv
Ghosh & Nanda, Harvard, 2010

2. IT companies have appropriately shorter sales cycles meaning that their products are commercialized promptly, ultimately meaning that VC can exit faster. The textbook example here is Google, that had an IPO 5 years after it received its first round of VC funding and having raised roughly $40m (!) in VC. As many VCs found out the hard way, energy companies don’t operate on those timelines. Consider this analysis by Matthew Nordan, a venture capitalist who specializes in energy and environmental tech. Of all the energy startups that received their first VC funds between 1995 and 2007, only 1.8% gained what he calls the end goal of a VC, meaning an initial public offering on a major exchange.

3. Whilst IT companies face incumbents with high-cost structures, clean energy companies face incumbents like ENI, Shell, and Exxon, who actually have lower cost structures owing to the fact they are giant, well-financed, often more than a century old and established, propped up by diversified investments.  And, yes, of course, the average IT company requires infrastructure investment, but it is on a whole other level relative to RE infrastructure, which requires an entire host of investments ranging from diffusors, chillers, arrays and transmission lines,  all of which must be manufactured, shipped and installed. It boils down to the fact that an RE company cannot scale and grow as quickly as an IT comply, delaying a potential exit for the VC.

None of this is to say that VC does not have value for RE, it does! VC are often the only private money willing to take the risk of investing in cutting-edge companies, but that’s their niche.  Remember that the venture capital niche exists because of the structure and environment of capital markets. Someone with an idea or a new technology often has no other source of financing to turn to. Banks will only finance a new company to the extent to which are hard assets against which to secure the debt, and renewable energy companies and clean tech actually do have hard assets.

tl:dr Renewable energy companies have capital requirements, growth profiles and competitive environments that do not make them ideal candidates for VCs.


Cover photo by Max Mudie/Alamy

Trend #1: Investment in Renewable Energy 2015

Old critiques, die hard. For the longest time, renewable energy (RE) has been viewed as too expensive and un-scalable, as a luxury energy source, that will not be deployed in developing countries. As a matter of fact, how many times did you hear the criticism, that by diverting investment away from so-called “cheap” fossil fuel energy, we would be depriving developing countries of their right to develop?

The numbers quantifying investments in RE are in! It should be no surprise that RE investment is increasing significantly and the developing world, especially China, is leading the way.

The findings of the United Nations Environment Programme (UNEP) Global Trends in Renewable Energy Investments 2016 confirmed that RE set new records in 2015 for dollar investments, the amount of new capacity added and the relative importance of developing countries in the context of that growth.

Record-breaking uptrend in Renewable Energy Investments

Global investment in RE rose 5% to $285.9 billion from 2014 to 2015, breaking the previous record of $278.5 billion reached in 2011 (FYI that’s double the dollar allocations to new coal and gas generation, which was an estimated $130 billion in 2015) when the famous ‘green stimulus’ programs in German and Italian were in full throttle. The figure below shows that the 2015 investment increased sixfold since 2004 and that investment in RE has not been below $230b since 2010.

GLOBAL NEW INVESTMENT IN RE BY ASSET CLASS, 2004-2015, $BN

global-investment-in-re-asset-class-2004-2015-b
Source: UNEP, Bloomberg New Energy Finance

*Asset finance volume adjusts for re-invested equity. Total values include estimates for undisclosed deals.

Over the course of the 12 years shown in the chart, the cumulative RE investment has reached $2.3 trillion.

Moreover, in 2015 some 134GW of RE excluding large hydro were commissioned, equivalent to some 53.6% of all power generation capacity completed in that year – and this is worth mentioning because it is the first time it has represented a majority. Of the renewables total, wind accounted for 62GW installed, and solar photovoltaics 56GW, highest ever figure and sharply up from their 2014 additions of 49GW and 45GW respectively.

Developing Countries Leading the Way

The investment which led to record-breaking levels came from China, which lifted its investment by 17% to $102.9 billion, about 36% of the global total. In the Middle East and Africa, investment was up a total of 58% at $12.5 billion, helped by project development in especially in South Africa and Morocco; and in India, up 22% at $10.2 billion.

More significantly, 2015 was the first year in which investment in RE (excluding large hydro) was higher in developing economies than in developed countries. The figure below shows that the developing world invested $156 billion last year, some 19% up on 2014 and a remarkable 17 times the equivalent figure for 2004, of $9 billion.

INVESTMENT IN RE: DEVELOPED/ DEVELOPING COUNTRIES, 2004-2015, $BN

global-new-investment-in-re-developed-vs-developing
source: UNEP, Bloomberg

The key contributors to this shift from developed to developing are the big three: China, India, and Brazil, who saw an investment rise of 16% to $120.2 billion

A large part of the record-breaking investment in developing countries took place in China. Indeed China has been the single biggest reason for the strong increasing trend for the developing world as a whole since 2004. In spite of low market fundamentals and much talk of decreased investment in RE, China has been a key contributor to these figures. China invested $102.9 billion in 2015, up 17%, representing well over a third of the global total.

Likewise, India enjoyed a second successive year of increasing investment, breaching the $10 billion for the first time since 2011.

Other developing countries, excluding the big three, lifted their investment by 30% last year to an all-time high of $36 billion, some 12x their 2004 investment, the biggest players are:

  • South Africa also deserves an honorable mention as it’s RE investment is up 329% at $4.5 billion significantly ramping up their solar PV, in the context of their auction program. In June last year, the government in Pretoria launched a tender for an additional 1.8GW for its renewables program. One of the signal deals later in the year was the financing in September of the 100MW Redstone solar thermal project for an estimated $756m, helped by loans from the World Bank’s International Finance Corporation and Overseas Private Investment Corporation of the US;
  • Mexico saw a 105% increase at $4 billion, aided by investment from the development bank Nafin for 9 wind projects. Moreover, Mexico is emerging as an important location for bond issues to back renewable energy projects. In November last year, National Financiera issued $500 million worth of five-year bonds to contribute towards the development of nine wind farms with a total capacity of 1.6GW;
  • Chile saw an increase of 151% higher at $3.4 billion, thanks to a sizable uptrend in solar project financings;
  • Morocco, Turkey, and Uruguay also saw investment increases in excess of the $1 billion milestone in 2015.

Developed world downward trend (mostly)

In the developed world, however, we are witnessing a downward trend quite consistently, since 2011, when it peaked at $191 billion, some 47% higher than the 2015 outturn. Developed countries invested $130 billion in 2015, down 8% and their lowest figure since 2009. This decline is due to two major factors:

  1. because of the US, where firstly; there was a rush of investment in 2011 as projects and companies tried to catch the Treasury grant and Federal Loan Guarantee programmes before they expired and secondly, the US Supreme Court’s decision in February 2016 to allow all legal objections to the Environmental Protection Agency’s Clean Power Plan to be heard before it can be implemented may be deterring investment in 2016.
  2. but much more to do with Europe, where allocations fell by 60% between 2011 and 2015. That big drop was caused by a mix of factors including retroactive cuts in support for existing projects in Spain, Romania and several other countries, an economic downturn in southern Europe that made electricity bills more of a political hot potato, the cut of government subsidies aimed at incentivizing RE in Germany and Italy, and the big fall in the cost of PV panels over recent years.Italy, in particular, saw renewable energy investment of just under $1 billion, down 21% on 2014 and far below the peak of $31.7 billion seen during the PV boom of 2011.

Retroactive cuts to feed-in tariffs really weaken support for solar energy investments. Spain, scene of particularly painful retroactive revenue cuts imposed by the government during the 2011-14 period, and the end of all support for new projects, saw investments of just $573 million in 2014. This was slightly up on the previous year but miles below the $23.6 billion peak of 2008.

But it’s not all bad in Europe, especially since the UK has not seen a significant slowdown in RE investments in recent years, and is actually pushing in the opposite direction. Moreover, in spite of the fact that offshore wind in the North Sea has seen massive investments amounting to $17b, Europe’s aggregate RE investment is still in decline.

SunEdison went bust, it’s a big deal.

380x252
SunEdison stock price Bloomberg

SunEdison, the largest renewable-energy firm in the world went bust last week with $16.1 billion of debt, making it the biggest U.S. bankruptcy in more than a year. In a nutshell, they were victims of their own success, as they grew too fast and burned way too much borrowed money in the process.

Their bankruptcy says more about reckless investor strategy than about the solar industry as a whole.

Bad Strategy: Too much focus on Growth

In 2014, SunEdison created two subsidiaries, called “yieldcos”, to manage the projects that it built assets for. They are called TerraForm Power and TerraForm Global, both separate and publicly traded. The purpose of these “yieldcos”  was to purchase energy projects from SunEdison and other developers at lower capital costs and attract (read: lure) investors who expected reliable dividends based on long-term power contracts.

Unsurprisingly, not all of its their investments proved successful, which is the name of the game in the project development world, but SunEdison’s win to loss ratio was evidently lopsided. It ended up with a lot of money tied it up in projects at various stages of completion, which it needed to sell to realise the gains and pay back creditors.

In order to make sure that the yieldcos had projects to develop, SunEdison had to grow, quick. That took a lot of (borrowed) money.

Circling the Drain

Things turned sour in July 2015, after it announced that it would try to acquire Vivint, a residential solar roof-top company, at a 52% premium (!). That deal for residential assets deemed inferior to the commercial assets SunEdison usually bought (read: utility-scale projects) hinted to investors that SunEdison may not have as much liquidity as they thought. And investor appetite for the yieldco abruptly ended.

SunEdison vs. Creditors

Things are also ugly between SunEdisons first- and second-lien lenders who are fighting over who will give them the money they need to get out of the bankruptcy.

  • If the first-lien lenders win: they will fire sell all of SunEdison’s projects, which would be disastrous for the solar market because there would be many solar projects on the market, resulting in lower prices for these projects.
  • If the second-lien lenders win: they will attempt to get more value out of these projects, the first-lien lenders, which is better for the solar market.  There is a lot of value in the project pipeline, which ultimately comprises cash-generating assets not tied to the continued existence of SunEdison, and it would be a shame if they were sold below value. But this will take time since investors will take time to do the due diligence to value these projects before buying them.

This does not bode well

SunEdison started off as having an investment portfolio of utility scale projects backed by governments, to investing in residential solar roof-top backed by private investors, therefore substantially increasing risk. Their free cash flow was negative and their net debt skyrocketed and eventually led to the bankruptcy. But SunEdison is not unique in that regard. Solarcity, SunPower and First Solar have managed a develop-and-sell business profitably over the past three years and are engaging in similar growth strategies all in plain view.